

Question Description
https://classroom.udacity.com/nanodegrees/nd002/pa…
Overview
In this project, you will make use of Python to explore data related to bike share systems for three major cities in the United States—Chicago, New York City, and Washington. You will write code to import the data and answer interesting questions about it by computing descriptive statistics. You will also write a script that takes in raw input to create an interactive experience in the terminal to present these statistics.
Bike Share Data
Over the past decade, bicycle-sharing systems have been growing in number and popularity in cities across the world. Bicycle-sharing systems allow users to rent bicycles on a very short-term basis for a price. This allows people to borrow a bike from point A and return it at point B, though they can also return it to the same location if they'd like to just go for a ride. Regardless, each bike can serve several users per day.
Thanks to the rise in information technologies, it is easy for a user of the system to access a dock within the system to unlock or return bicycles. These technologies also provide a wealth of data that can be used to explore how these bike-sharing systems are used.
In this project, you will use data provided by Motivate, a bike share system provider for many major cities in the United States, to uncover bike share usage patterns. You will compare the system usage between three large cities: Chicago, New York City, and Washington, DC.
The Datasets
Randomly selected data for the first six months of 2017 are provided for all three cities. All three of the data files contain the same core six (6) columns:
- Start Time (e.g., 2017-01-01 00:07:57)
- End Time (e.g., 2017-01-01 00:20:53)
- Trip Duration (in seconds – e.g., 776)
- Start Station (e.g., Broadway & Barry Ave)
- End Station (e.g., Sedgwick St & North Ave)
- User Type (Subscriber or Customer)
The Chicago and New York City files also have the following two columns:
- Gender
- Birth Year
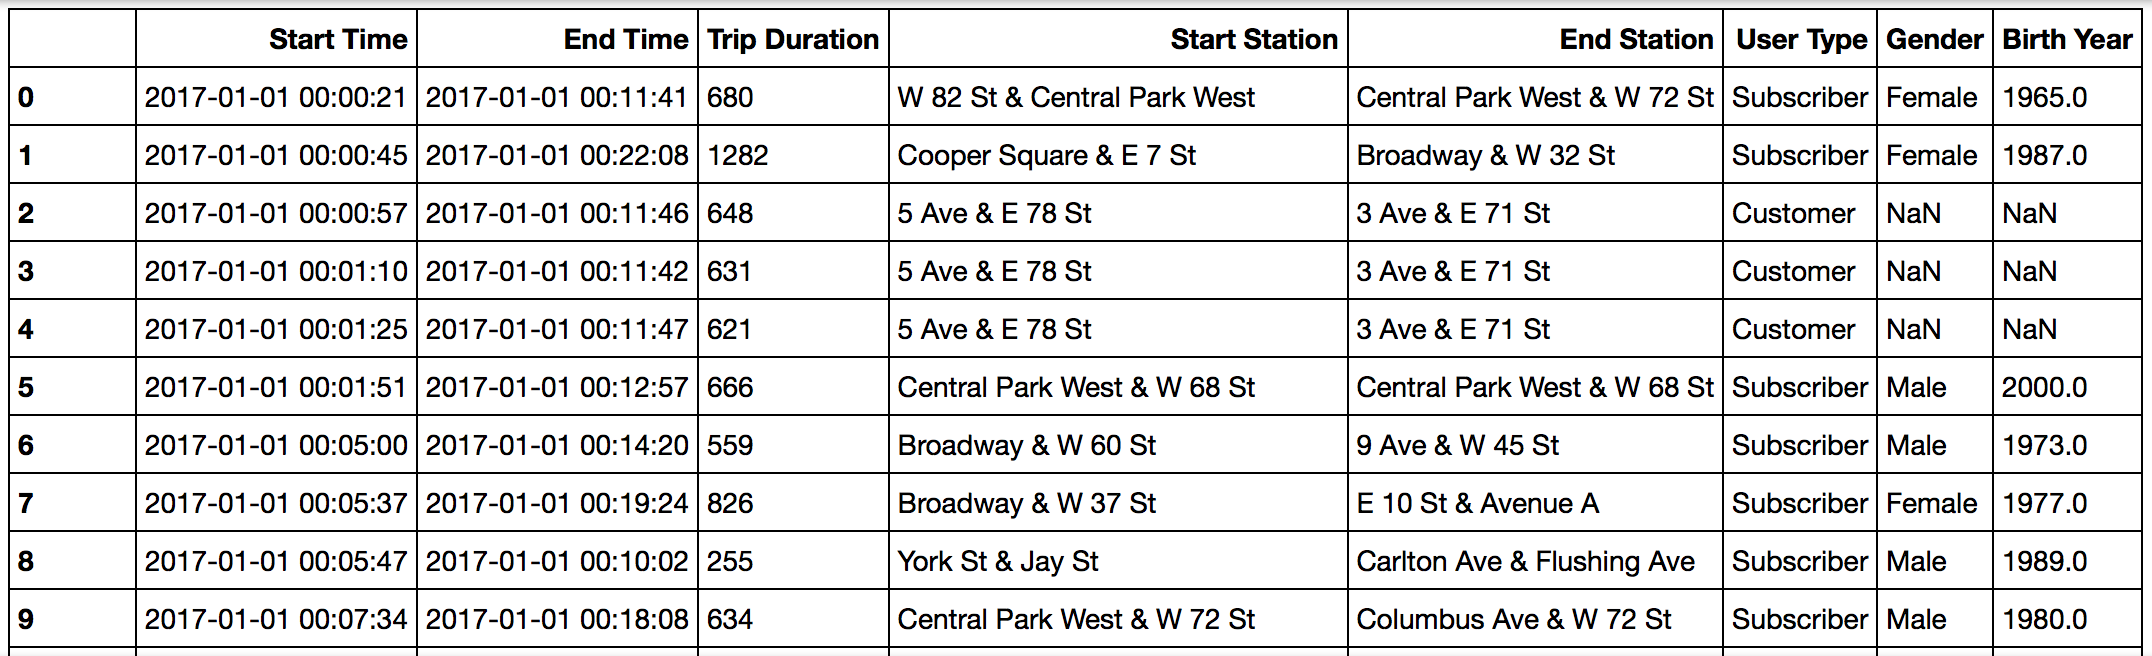
Data for the first 10 rides in the new_york_city.csv file
The original files are much larger and messier, and you don't need to download them, but they can be accessed here if you'd like to see them (Chicago, New York City, Washington). These files had more columns and they differed in format in many cases. Some data wrangling has been performed to condense these files to the above core six columns to make your analysis and the evaluation of your Python skills more straightforward. In the Data Wrangling course that comes later in the Data Analyst Nanodegree program, students learn how to wrangle the dirtiest, messiest datasets, so don't worry, you won't miss out on learning this important skill!
Statistics Computed
You will learn about bike share use in Chicago, New York City, and Washington by computing a variety of descriptive statistics. In this project, you'll write code to provide the following information:
#1 Popular times of travel (i.e., occurs most often in the start time)
- most common month
- most common day of week
- most common hour of day
#2 Popular stations and trip
- most common start station
- most common end station
- most common trip from start to end (i.e., most frequent combination of start station and end station)
#3 Trip duration
- total travel time
- average travel time
#4 User info
- counts of each user type
- counts of each gender (only available for NYC and Chicago)
- earliest, most recent, most common year of birth (only available for NYC and Chicago)
The Files
To answer these questions using Python, you will need to write a Python script. To help guide your work in this project, a template with helper code and comments is provided in a bikeshare.py file, and you will do your scripting in there also. You will need the three city dataset files too:
- chicago.csv
- new_york_city.csv
- washington.csv
All four of these files are zipped up in the Bikeshare file in the resource tab in the sidebar on the left side of this page. You may download and open up that zip file to do your project work on your local machine.
Some versions of this project also include a Project Workspace page in the classroom where the bikeshare.py file and the city dataset files are all included, and you can do all your work with them there.
Our website has a team of professional writers who can help you write any of your homework. They will write your papers from scratch. We also have a team of editors just to make sure all papers are of HIGH QUALITY & PLAGIARISM FREE. To make an Order you only need to click Ask A Question and we will direct you to our Order Page at WriteDemy. Then fill Our Order Form with all your assignment instructions. Select your deadline and pay for your paper. You will get it few hours before your set deadline.
Fill in all the assignment paper details that are required in the order form with the standard information being the page count, deadline, academic level and type of paper. It is advisable to have this information at hand so that you can quickly fill in the necessary information needed in the form for the essay writer to be immediately assigned to your writing project. Make payment for the custom essay order to enable us to assign a suitable writer to your order. Payments are made through Paypal on a secured billing page. Finally, sit back and relax.
About Writedemy
We are a professional paper writing website. If you have searched a question and bumped into our website just know you are in the right place to get help in your coursework. We offer HIGH QUALITY & PLAGIARISM FREE Papers.
How It Works
To make an Order you only need to click on “Place Order” and we will direct you to our Order Page. Fill Our Order Form with all your assignment instructions. Select your deadline and pay for your paper. You will get it few hours before your set deadline.
Are there Discounts?
All new clients are eligible for 20% off in their first Order. Our payment method is safe and secure.